
DOOH Impression Multiplier and Adjustment Factor
We discuss the subject of data transformation from a detection metric into an audience metric.
This article explores what the factors are that can accelerate DOOH towards the “holy grail” of cross-platform media compatibility. In it, we will discuss the subject of data transformation from a detection metric into an audience metric. This article is also an excerpt from a larger work, Quividi's DOOH Audience Impressions White Paper which can be downloaded here.
Adjustment: From Detection to Impressions
Due to natural or commercial limitations, it is non-trivial to adapt any measurement technology so its detection zone is a perfect match for the viewability zone of the DOOH display unit. In the case of a mismatch between zones, a formulaic adjustment is necessary to transform the metric from the detection mechanism, in this case Quividi, to the cross-platform human-valid ad audience impression metric.
Viewability Zone vs Detection Zone
The viewability zone is part of the definition of what makes an audience impression. Quividi’s detection zone, in contrast, is based on the limits of detection technology (for instance, most cameras have a horizontal field of view of less than 80°). They are different metrics. It is possible, for example, for an audience impression to be valid and yet beyond detection.
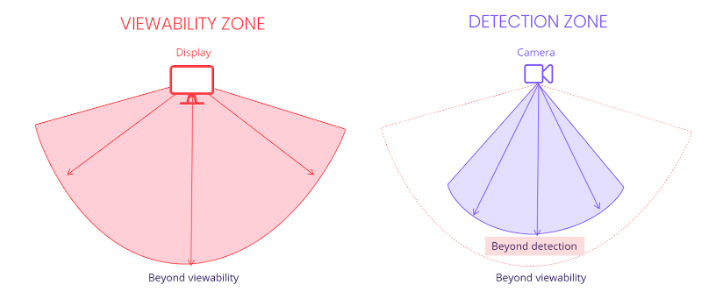
In this illustration, the detected audience will always be inferior to the actual audience (impressions). Typically, if adjustments are necessary, it is because the detection zone is inferior to the viewability zone. The inverse is rare.
Conversion By Adjustment Factor
To compensate for differences between the detection zone and viewability zone, Quividi’s detection metric, Watchers, is multiplied by an adjustment factor to convert it into audience impressions. The mathematical model behind this adjustment factor is based on journey mapping.
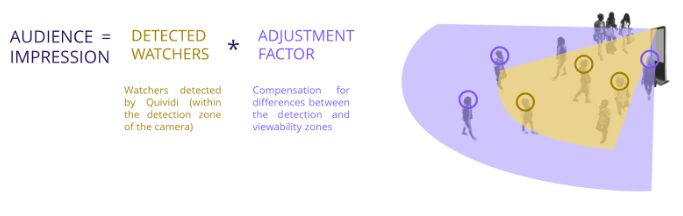 Quividi estimates live audience impressions by multiplying its live detection metric (Watchers) by an adjustment factor.
Journey Mapping Conversion Model
Quividi’s proprietary conversion model adjusts its detection metric (Watchers) in real-time into the human-valid audience impression metric that best evaluates the total actual audience of a display.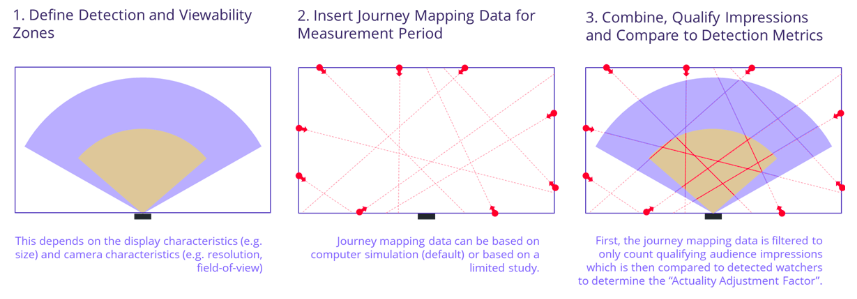 The layers of Quividi's proprietary journey mapping conversion model.
This conversion model takes into account the characteristics of the display and of the camera, as well as the field of view of each watcher.
Quividi has developed a sophisticated journey mapping simulating engine, that adapts to every venue and simulates the traffic that would pass by the display and will be detected in the camera detection zone. The resulting journey mapping and detection data are compared to create the conversion model.
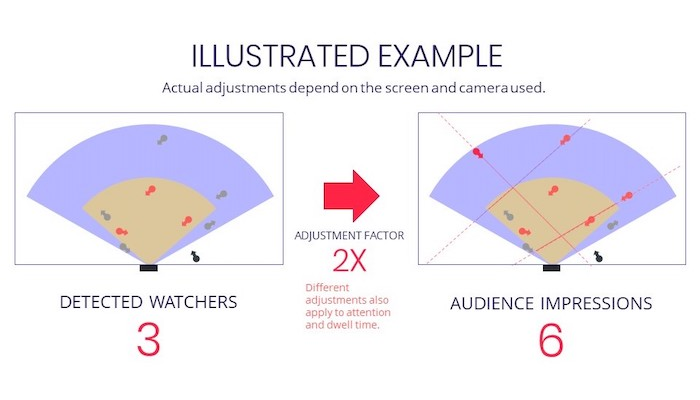
The conversion adjustment factor is calculated both for the audience number, as well as their dwell time and attention time.
Real-Time Conversion by Adjustment Factor
Due to the nature of the modelling, it is possible for Quividi to provide live reporting of cross-platform human-valid audience impressions in real-time, despite any limitations in detection technology.
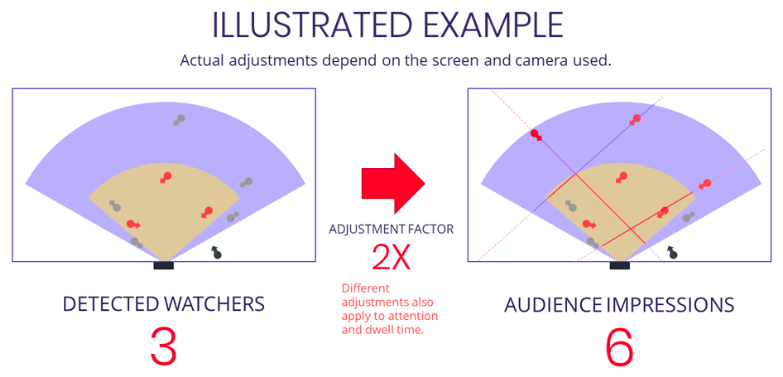 This illustrates how the adjustment factor obtained from Quividi's journey mapping conversion model transforms the detection metric (Watchers) into cross-platform human-valid audience impressions.
Conclusion
In this article, we discussed why audience measurement needs adjustments due to natural differences between the detection technology and the reality of the audience for the display. We also explained Quividi’s method of performing that adjustment.Bring us your network. We’ll show you the data.
Thirty minutes with a Quividi solutions architect, your fleet topology, a sandbox you can poke at.