
Listing Metrics and KPIs in DOOH Advertising
The purpose of advertising campaigns in DOOH and elsewhere is to capture attention of the target audience, engage them in a conversation, win their trust and loyalty towards the brand, and ultimately sell a product, a…
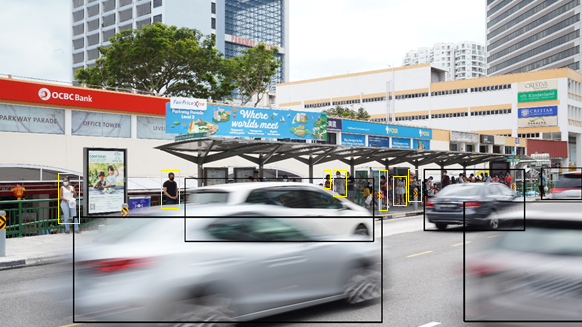
The purpose of advertising campaigns in DOOH and elsewhere is to capture attention of the target audience, engage them in a conversation, win their trust and loyalty towards the brand, and ultimately sell a product, a service or an idea.
To be able to reach those goals effectively, the advertiser needs to be informed about all aspects of the campaign performance, as well as any relevant past campaigns, and of course, specifics of each medium and location.
That can only be achieved via comprehensive measurement - collecting data from multiple relevant data sources and evaluating all aspects of that data through various lenses, or metrics.
In DOOH Advertising, there is a rich selection of data sources to consider, and we mentioned some of them in the previous article. All of them are different - in depth, coverage, accuracy, sophistication, accessibility and associated costs. They can tell many stories, if analysed in the right way - through the lens of meaningful metrics, to produce a rich set of key performance indicators, or KPIs. Often, the same KPI can be derived from very different data sources. For example, impressions can be measured using people counters, Wi-Fi sensors, cameras or even surveys. Depending on specifics of each particular data source and corresponding measurement tools, the results may be different. This doesn't mean they are all incorrect, they are just showing different facets of the same fact. It is therefore important to carefully choose data sources for each metric and KPI and understand their intrinsic limitations - to be able to scientifically adjust and effectively use the results to create actionable insights.
For many years, the Advertising industry has been working to fine-tune measurement tools and analytic methods paving the way to the standardisation of metrics. This has become an evident trend in Digital Advertising, which is already operating a number of established currencies and measurement frameworks to buy slots for online advertisements. However, in a relatively new area of DOOH Advertising, standards are not yet fully established, and there is an ongoing discussion about the best metrics for trading and campaign performance tracking.
This discussion is in many ways shaped by advertisers, as they consider DOOH as another channel, which can be successfully used in combination with other media, such as Digital Advertising, TV, Print etc. To make these omnichannel use cases efficient, advertisers and their agencies are looking for familiar metrics and methods of campaign planning and performance evaluation. This forces DOOH media owners to provide metrics and KPIs compatible with or similar to existing advertising metrics adopted in other channels.
Being intrinsically digital, DOOH most frequently borrows concepts from Digital (Online, Web) Advertising, which is, in turn, based on the standards established in the larger Advertising industry.
Let us review the most important metrics and KPIs in DOOH and how they compare to their Online counterparts.
Impressions
This metric is the most direct equivalent of Impressions in Digital Advertising, where it is defined as the number of times an ad copy was displayed to a user on a chosen advertising network. Online ads work in a 'one-to-one' mode (one playback normally means one potential viewer, thus one impression). DOOH displays are routinely seen by multiple passers-by, which makes it a 'one-to-many' media. Consequently, in Out-Of-Home, the Impressions metric takes into account potential exposures of the ad to all passers-by, on each play.
There are various methods of calculating the Advertising Impressions. One of the most common approaches is based on ‘Opportunities-To-See’ (OTS). This term is mostly used as an equivalent to a raw circulation number, though it is often limited to the area in front of the advertising display. Another word for OTS is traffic.
Due to 'one-to-many' operation mode of Out-Of-Home Advertising and diverse types of physical locations where it operates, the raw data collected to measure potential Impressions may include traffic that ends up not seeing the ad due to a physical obstruction, screen location, size and distance. To alleviate the impact of such factors and get a more qualified version of OTS counting individuals with a higher probability of seeing the ad, the industry has been trying multiple OTS alternatives over the past decade, such as Visibility Adjusted Contact, Average Unit Audience, Viewable Impressions and Likelihood-To-See. All of them involve methods to discount the raw, Total Impressions metric by some scientifically derived factors - to get closer to the most accurate assessment of Impressions in physical environments. Such Impression Multiplier and Adjustment Factors are typically calculated using models created from visibility studies.
There currently are three most prevalent approaches to such adjustments:
• Using raw OTS/Impression numbers as delivered by a chosen provider, data source or measurement technology, without adjustments,
• Using a Likelihood-To-See approach in cooperation with a local industry association,
• Using a proprietary impression multiplier to adjust the raw traffic numbers.
Impressions in DOOH can be accurately measured using body counting via an Anonymous Video Analytics platform. In some environments, such as large-format outdoor displays, roadside billboards, mixed and vehicle-dominated environments (e.g. car parks), it may be more efficient to use vehicle counting technologies and apply corresponding multiplication factors to account for an average number of people in a car. Wi-Fi mobile phone sensors and mobile location data are also commonly used in those scenarios.
Unique Reach and Frequency
Similar to their Digital counterparts (Unique Traffic vs Repeat Traffic), these Out-Of-Home metrics reflect the number of unique people exposed to an advertising campaign (Unique Impressions) and the number of times they could see that campaign. This KPI requires data and methods able to process unique but anonymous features of individuals in an aggregated manner while ensuring that such data and methods are fully compliant with global best practices and legislation in privacy protection.
Unique Reach and Frequency are usually measured using mobile location data or Wi-Fi mobile phone sensors. Real-time audience data collected by an Anonymous Video Analytics platform can be correlated with those sources to get enhanced and more granular Reach KPIs.
Watchers
This DOOH metric shows the number of people who actually looked at the digital screen or the advertisement. This is a subset of Impressions and helps to further narrow down and qualify the raw Impressions KPI. Watchers can be seen as an equivalent of the Viewed (Viewable) Impressions in Online Advertising. As digital screens are normally designed and installed in a way ensuring an unobstructed view in the adjacent area, and this KPI is acquired via face detection, the number of Watchers is a high-quality metric showing the number of times a campaign was actually viewed by people in a specified detection area. This metric can be filtered down to Qualified Watchers - by including only those who watched for 1 second or more. There is a growing interest from Advertisers towards such qualified metrics with an emphasis on exposure time, attention and engagement, for example, the global 3MS Consortium of major digital ad buyers and sellers requires static ads to be viewed for 1 second, and video ads - for 2 seconds - to qualify for a Viewable Impression (Digital Advertising equivalent of Watchers).
The Watchers metric can only be produced via a robust Anonymous Video Analytics system equipped with a camera.
Conversion Rate
There are different variants of this metric available, each illustrating Conversions at different levels of the sales funnel. In DOOH, as in many digital and non-digital media, Conversions can be defined in a number of ways. The most straightforward way, i.e. the number of sales via the ad, which is possible in an online store scenario, is often hard to follow in Out-Of-Home due to challenges in attribution of a purchase to a particular advertising campaign in a particular advertising channel. However, it still can be done using comprehensive tracking capabilities provided by mobile location data with geofencing; some advanced features of Wi-Fi mobile phone sensors; surveys; QR codes and some other ways. These approaches are not exhaustive and require additional measures, like correlation and extrapolation, to make them more reliable and representative. Such sales- or in-store traffic-related Conversions are usually calculated by agencies or via sophisticated Data Management Platforms equipped with Campaign Intelligence capabilities.
On the other hand, Conversion can be defined as another, more easily measurable and attributable action. Simpler forms of Conversions could be a view, a longer view, a longer presence, a touch, a visit, a download or a registration. Then, the Conversion Rate can be defined, for example, as a proportion of Watchers in the overall Impressions figure. For Advertisers, having multiple ways to measure the Conversion Rate provides a significant value, as it allows them to more clearly understand the impact their campaign is having on their target audience.
Dwell Time
Dwell, or Presence Time means the total time a potential watcher spent near the advertising display. Dwell Time can be measured for an average Impression and for Watchers. It does not show if the ad was watched during this time at all, but rather demonstrates an opportunity to engage the Watcher. Dwell Time in DOOH can be compared to Average Session Duration in Online Advertising.
This metric is routinely provided by many audience measurement tools, for example, by Anonymous Video Analytics, mobile location data platforms, or Wi-Fi mobile phone sensing solutions.
Attention Time
This metric allows to qualify the Dwell Time of a Watcher. It shows how much time was spent actually watching the advertisement. This is a measure of engagement, and so is highly important to advertisers. The closest equivalents of this metric in Digital Advertising are Bounce Rate and Time On Page (with regards to users' behaviour on a website).
This DOOH metric can only be effectively measured using an Anonymous Video Analytics platform equipped with a camera, as it requires a strong evidence of people watching the screen. To some extent, this can also be achieved with studies and surveys.
Audience Segmentation
Out-Of-Home environment allows for comprehensive segmentation of the audience using a variety of tools and dimensions. Demographics (age, gender) can be measured for each Watcher with a camera sensor. It also can be estimated on average for specific locations, day parts, and across a rich set of audience profiles enabled by mobile location data. This set of metrics can be effectively used by brands to define their target audiences and ensure their campaign reaches them.
CPM (Cost-Per-Mille)
CPM is a financial aspect of each advertising campaign showing cost per thousand impressions and thus allowing to evaluate the efficiency of advertising as compared to other channels or campaigns. This metric is broadely used in Advertising, including traditional and Digital media. Along with the Impressions, it effectively bridges the Out-Of-Home and Online worlds by providing the most common measures as a baseline for the both environments. CPM is essential for the media planning and buying process. It is derived from the average and actual Impressions figures provided by the media owner along with the cost of advertising on that media.
Return on Ad Spend (ROAS)
Another important financial aspect of any campaign demonstrating its actual impact on the brand's revenue is Return on Ad Spend. This metric is often hard to deliver in Out-Of-Home and omnichannel campaigns. It is highly dependent on the possibility to measure Attribution, i.e. to understand if particular actions, such as purchases, were performed because of the ad. There are many ways to measure attribution, but all of them require multiple data sources and employ scientific methods of correlation and analysis. Surveys, QR codes, referral links, as well as mobile location data are commonly used to achieve this. To get a reliable assessment, brands/advertisers are using sophisticated internal methods, as well as services from Media Agencies, third-party Data Management Platforms (with Campaign Intelligence capabilities) and media owners.
In addition to all the measures described above, there is also a subset of metrics provided in real-time or near real-time by employed audience measurement technology platforms and solutions and enabling continuous optimisation, contextualisation, personalisation and targeting capabilities for advertising campaigns. Such real-time data may include presence of the audience, number of people near the screen, distance, mood, gesture detection etc. Those data points can be utilised by Creative Agencies and media owners to develop smart advertising content which is able to automatically adapt to the audience and the context at each location and any time of day. This creates huge potential for stronger engagement with potential customers, as well as extra attribution opportunities and increased sales.
There are many other metrics and KPIs available across the full spectrum of data sources that can be used in DOOH. The evolution of relevant data sources fuels further development of measurement and analytics frameworks.
In many cases DOOH metrics can be combined with location data and other external data sources (e.g. current weather, stocks, traffic, sales etc.) - to produce audience- and context-aware insights accurately describing any specific aspects of campaign performance. Due to varying levels of data quality, and a growing pressure from advertisers towards greater transparency, accountability and compatibility with other channels' metrics, DOOH is developing local and global best practices around data and metrics, and those best practices are set to be gradually transformed into standards.
Increasing focus on personal privacy and the use of datasets around the world adds restraints and puts in place reasonable limitations on the scope of data collection in Advertising. This is a major factor the industry must consider while developing metrics and lining up approved methods of measurement.
The evolution of the audience, location and campaign performance measurement ecosystem will no doubt continue into the future, driven by the technology innovation, personal privacy considerations, and, ultimately, by business requirements of advertisers. It is ultimately the brands that fund the whole industry and thus shape the demand for data.
In the next article we will have a look at the DOOH data and metrics from the brand perspective - to analyse their data journey and the value they are looking for.
Bring us your network. We’ll show you the data.
Thirty minutes with a Quividi solutions architect, your fleet topology, a sandbox you can poke at.